Charts can be added to an Elementor page in different ways.
You can add charts as:
- Single chart tracklist (large or compact)
- Chart archive
- Chart carousel
How to display a single chart tracklist with Elementor
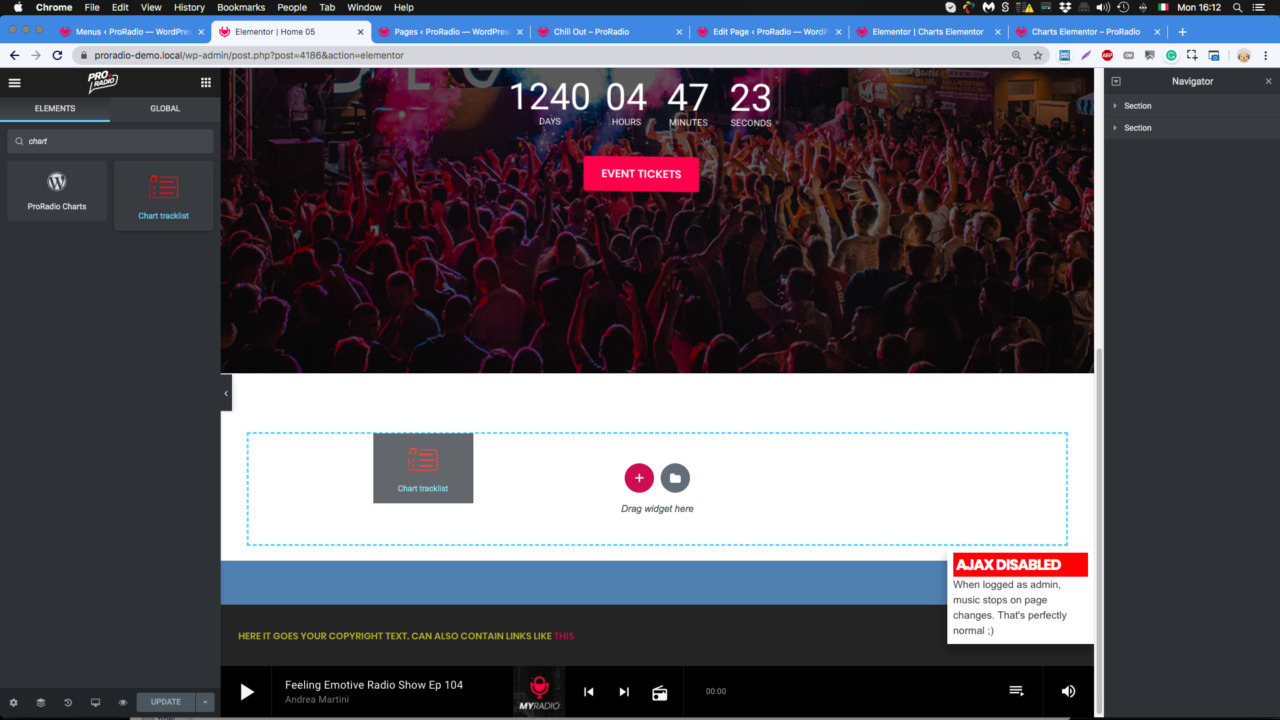
Step 1: Edit your page with Elementor
Step 2: search Chart in the widgets
Step 3: Drag in your page the Chart Tracklist element (nor ProRadio Charts as this is a sidebar widget). The latest chart will be pulled from the archive by default.
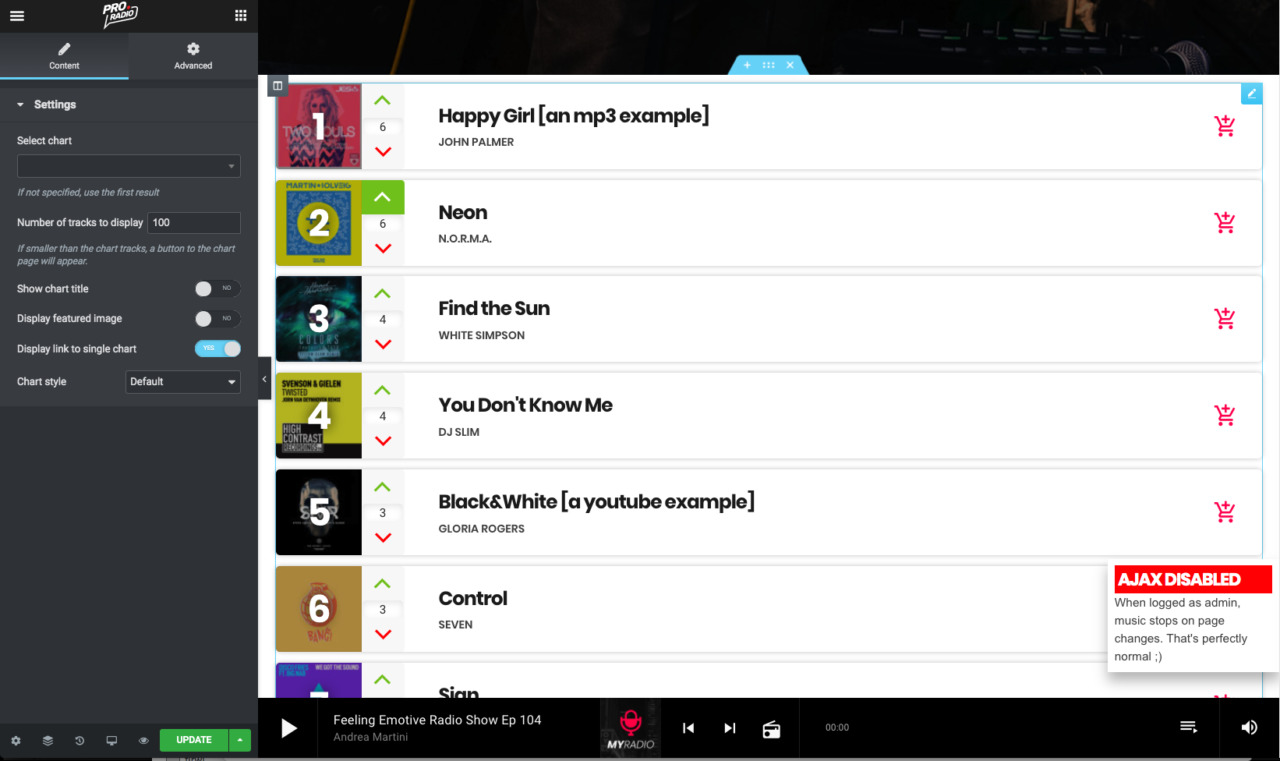 Parameters
- Select chart: choose a chart from the dropdown
- Number of tracks: you can display a smaller amount of tracks
- Show chart title and Display featured image: those 2 elements can be pulled automaically from the single chart.
- Display link to single chart: show a button below the tracks to link to the single chart page. This is only available if you show less than the total amount of tracks.
- Chart style: choose between compact and extended. If you place the chart into a small column, we recommend chooseing compact.
How to display a chart archive with Elementor
Step 1: Edit your page with Elementor
Step 2: search Grid in the widgets, then add Post or Pages grid
Step 3: Load more button: enable to display a button that will load more items.
Step 4: set the columns for desktop or tablet. Please remember that you will need to set the Max Items accordingly for the amount of items per row.
You should choose an amount of items per row that is more or less a third of the total. So, if you have a column large as 66% of the container, you may set 2 posts per row, while for a full width column, is ok to set 3. If the column is a third, you should set 1 column per row.
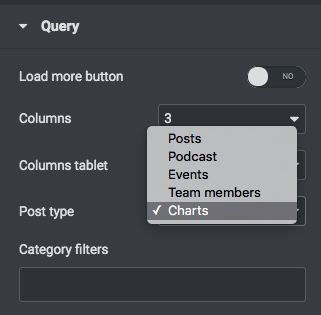
Step 5: open the Post Type dropdown and select Chart
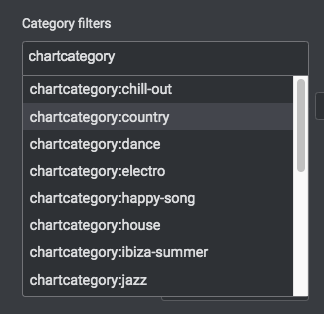
 Step 6: optionally filter by chart category, type "chart" in the Category Filters and select the one you want to use as filter for your results.
 Step 7: set the max items
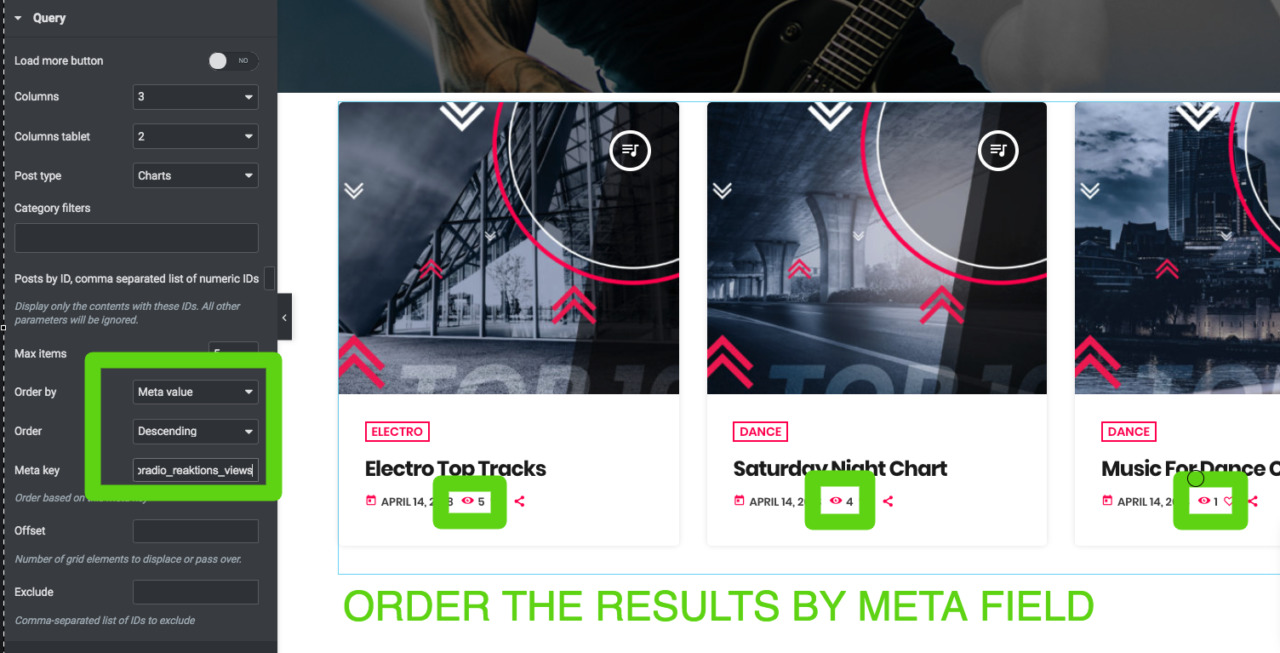
Step 8: optionally select custom parameters to order the results.
Ordering by Reaktions (views, rating, share)
You can, for instance, extract the charts by the most liked or most viewed.
Important: the most voted or most viewed are META Fields. To use these parameters, set Order By to Meta Value.
In the field Meta Key, input:
- proradio_reaktions_views to order by views
- proradio_reaktions_votes_count to order by likes
- proradio_reaktions_shares_count to order by share (please note that this tracks the clicks on the share button and doesn't verify if the sharing action is finalized by the customer, as this requires API integrations which are not part of the Reaktions plugin. For more info check the ReAktions plugin page)
In this example, the results are ordered by Views Count